STUDY
7/0
About
In Study 7/0 we explore the positioning errors of a static GPS receiver through a series of generative procedures. The project is motivated by the idea of cognitive mapping as a configuration of individual, non-linear and discontinuous spatiotemporal experiences, and their outcomes. We use technical flaws as a conceptual source material for further creative processing and expression. We also investigate the effective approaches to emergence in generative art, where a simple initial setup of a complex system can produce surprising phenomena. For this initial iteration of the project we created an animation based on the 2D waypoint data (longitude and latitude) and the timestamps recorded in the GPS Track Log path.
We secured a GPS receiver to a desk, powered it up, and let it run a Track Log function for 7 days, 7 hours, 16 minutes and 11 seconds. While the ideal Track Log plot for an immovable GPS receiver is essentially a single point, our setup had recorded 8438 positions on a 34.7km long path covering an area of 2.1km2, with an average speed of 0.2km/h and a maximum speed of 17.9km/h. This is a consequence of the limited precision of a GPS receiver operating inside a building under slightly changing weather, combined with the inaccuracy of GPS infrastructure.
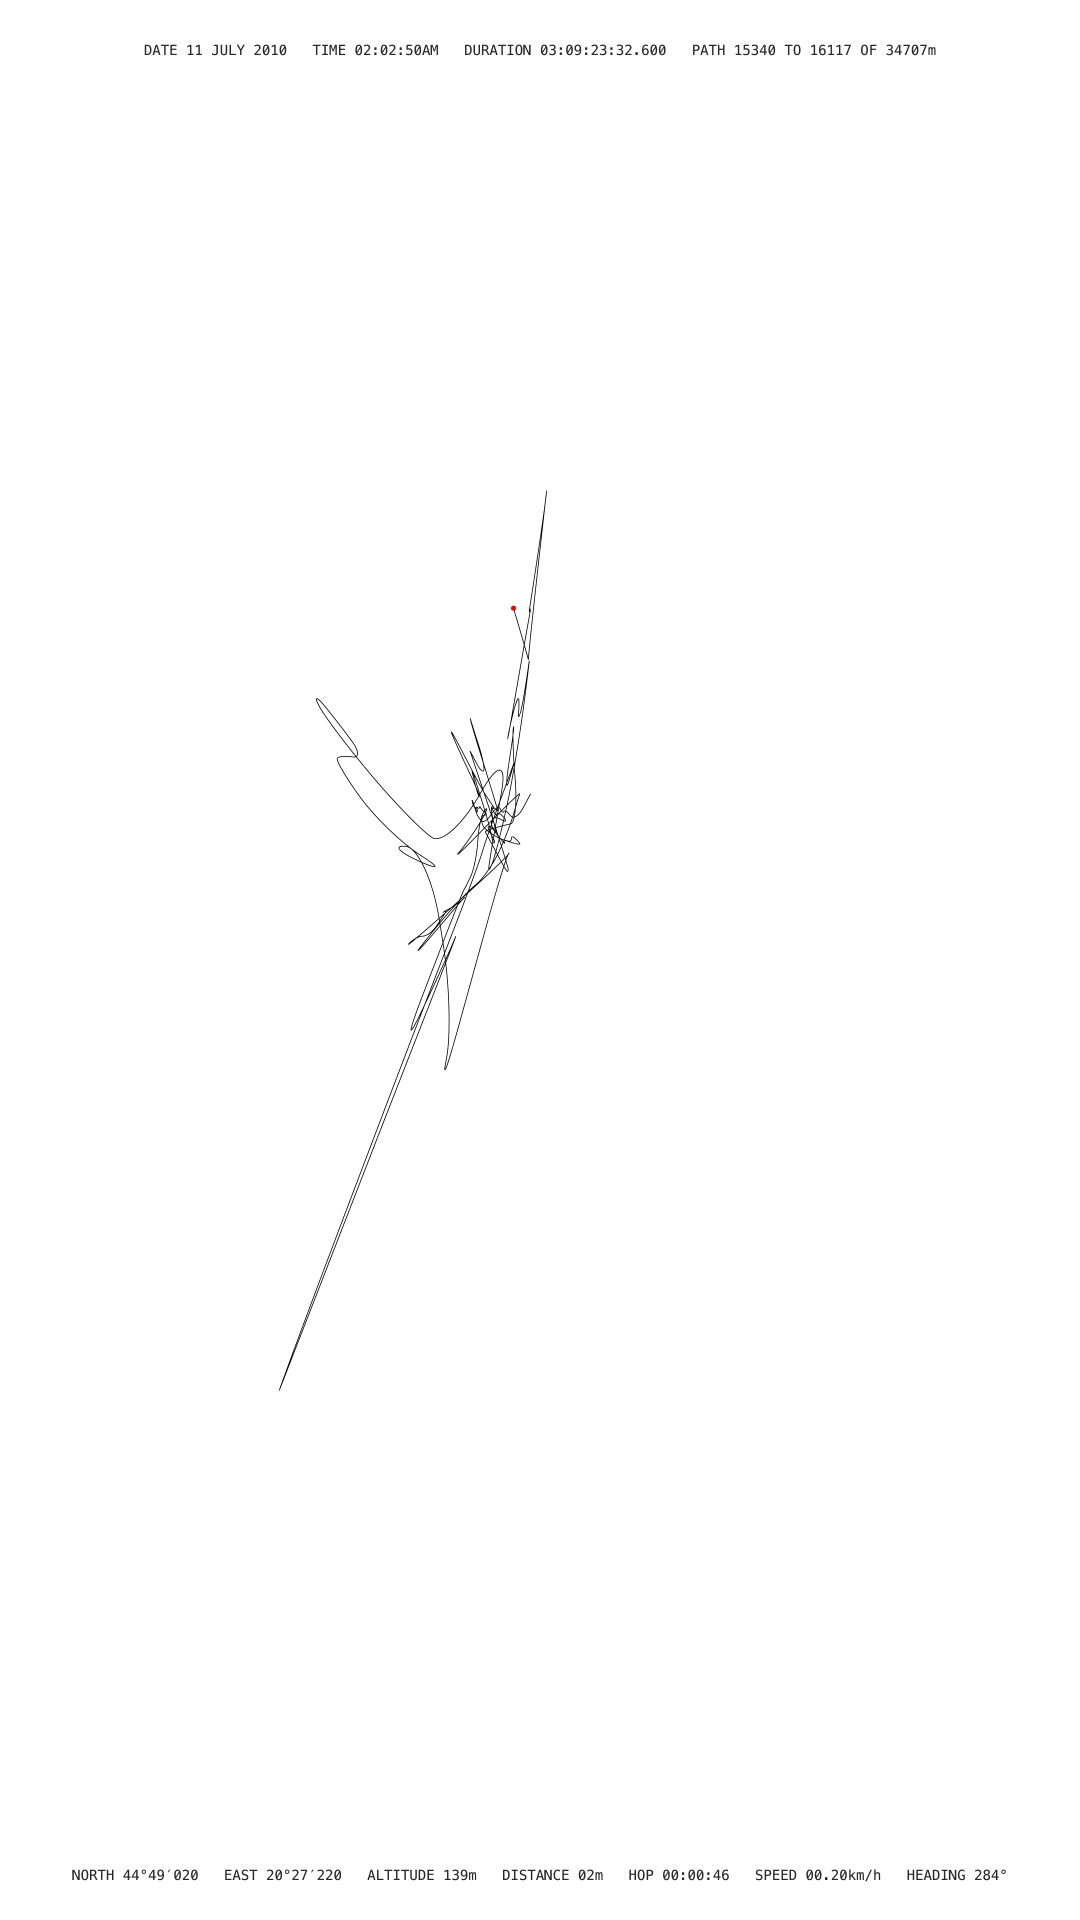
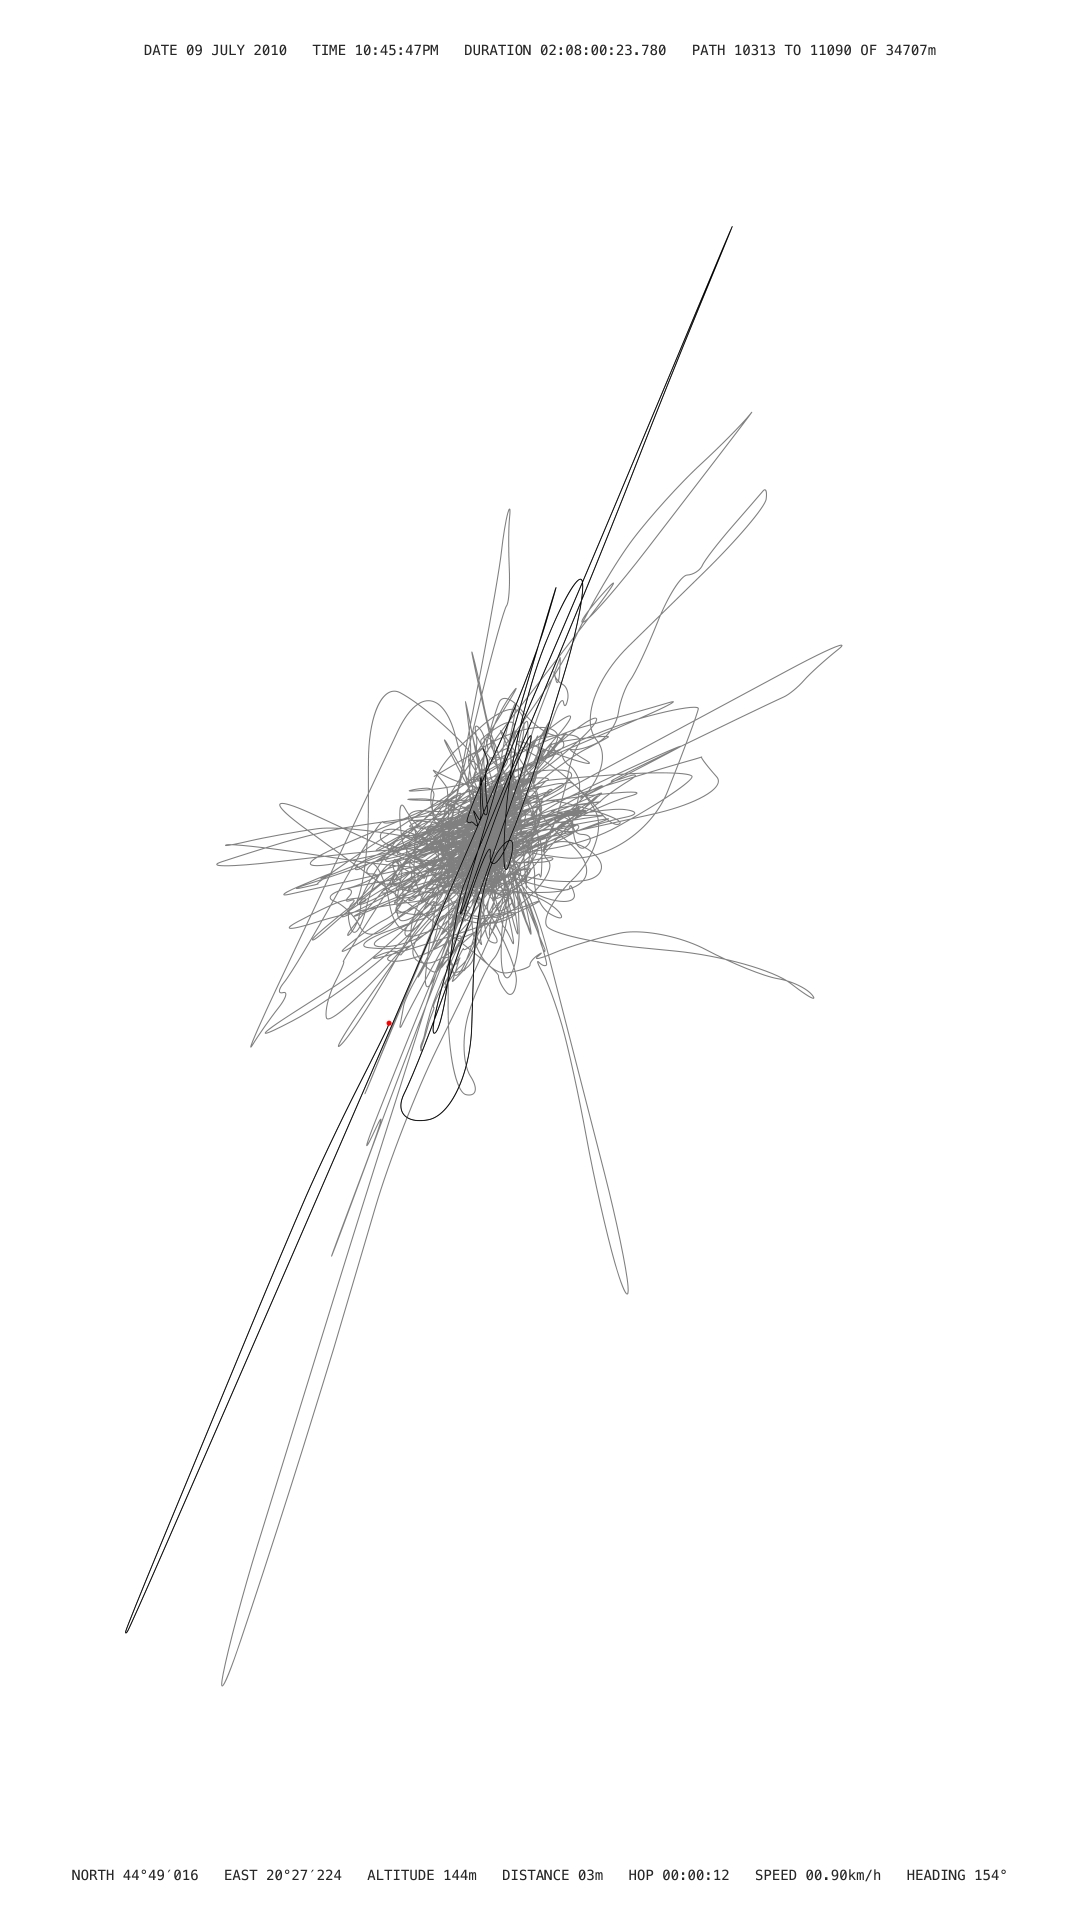
We used the timestamps of the 2D waypoint data (longitude and latitude) to animate a red dot along the horizontal projection of the Track Log path, speeding up the 630,971 seconds of the real-time record to 281 seconds. In the animation on the left, we isolate the current 2.25% (780m) section of the whole path, revealing the intricate dynamics of error-generated virtual motion. In the right animation, we follow the current 2.25% building up the whole path. To contextualize the visuals, we display all numerical values from the Track Log dataset.
We consistently applied the Track Log dataset as a generator for the sound, following the metaphor of movement in real space to exploit the acoustic phenomena that result from it, such as Doppler effect and air absorption effect.
Video
Study 7/0 (Parallel).
Concept
Study 7/0 explores the positioning errors of a static GPS receiver in a series of media transcoding procedures. It is motivated by the idea of cognitive mapping as a configuration of individual, non-linear, and discontinuous spatiotemporal experiences. As a wayfinding technological framework, the GPS facilitates a layered set of interactions, observations, preferences, choices, decisions, and compromises that constitute contemporary way of life. Since the useful GPS routes are always defined by accessibility and environmental constraints such as geography, traffic, consumption, and communication flows, the errors of that system point to the idiosyncratic misalignment between the subjective identity and the functional requirements of human artefacts. In a broader symbolic sense, the individual’s navigation through, and adaptive correction of the systemic imperfections of complex infrastructures such as the GPS point to the notion that politics, before it becomes public, is always a personal, intimate matter (Grba 2010a).
While the majority of new media artworks since 1998 have relied on accuracy and reliability of the GPS for various forms of mapping, tracing, and transcoding (Wilson 2002), in Study 7/0 we focus on error and unreliability as the logical counterparts but at the same time also as the criteria (measures) of the utility of the GPS or any other technical system. We use technical flaws as a conceptual source material for further generative processing and expression, unlike the conventional glitch art in which the error is an aestheticized frontline layer (Barker 2012). In a series of stages of this project, we also investigate the effective approaches to emergence in generative art, where a simple initial setup of a complex system can produce surprising phenomena (Grba 2015, Boyé et al. 2019).
GPS Dataset
We secured a Garmin GPSmap 60Cx GPS receiver to a desk, powered it from the outlet, selected the Track Log function, and let it run for 7 days, 7 hours, 16 minutes and 11 seconds (from 7 July 2010 04:46:36PM to 15 July 00:02:47AM). Garmin GPSmap 60Cx is a handheld GPS navigation device, well regarded for its high sensitivity, accuracy, functionality, ruggedness and reliability. Track Log function starts as soon as the receiver gets a satellite location fix and saves the time, location, elevation, distance, and speed data about the waypoints which are automatically created according to a selected sampling method: time, distance or frequency.
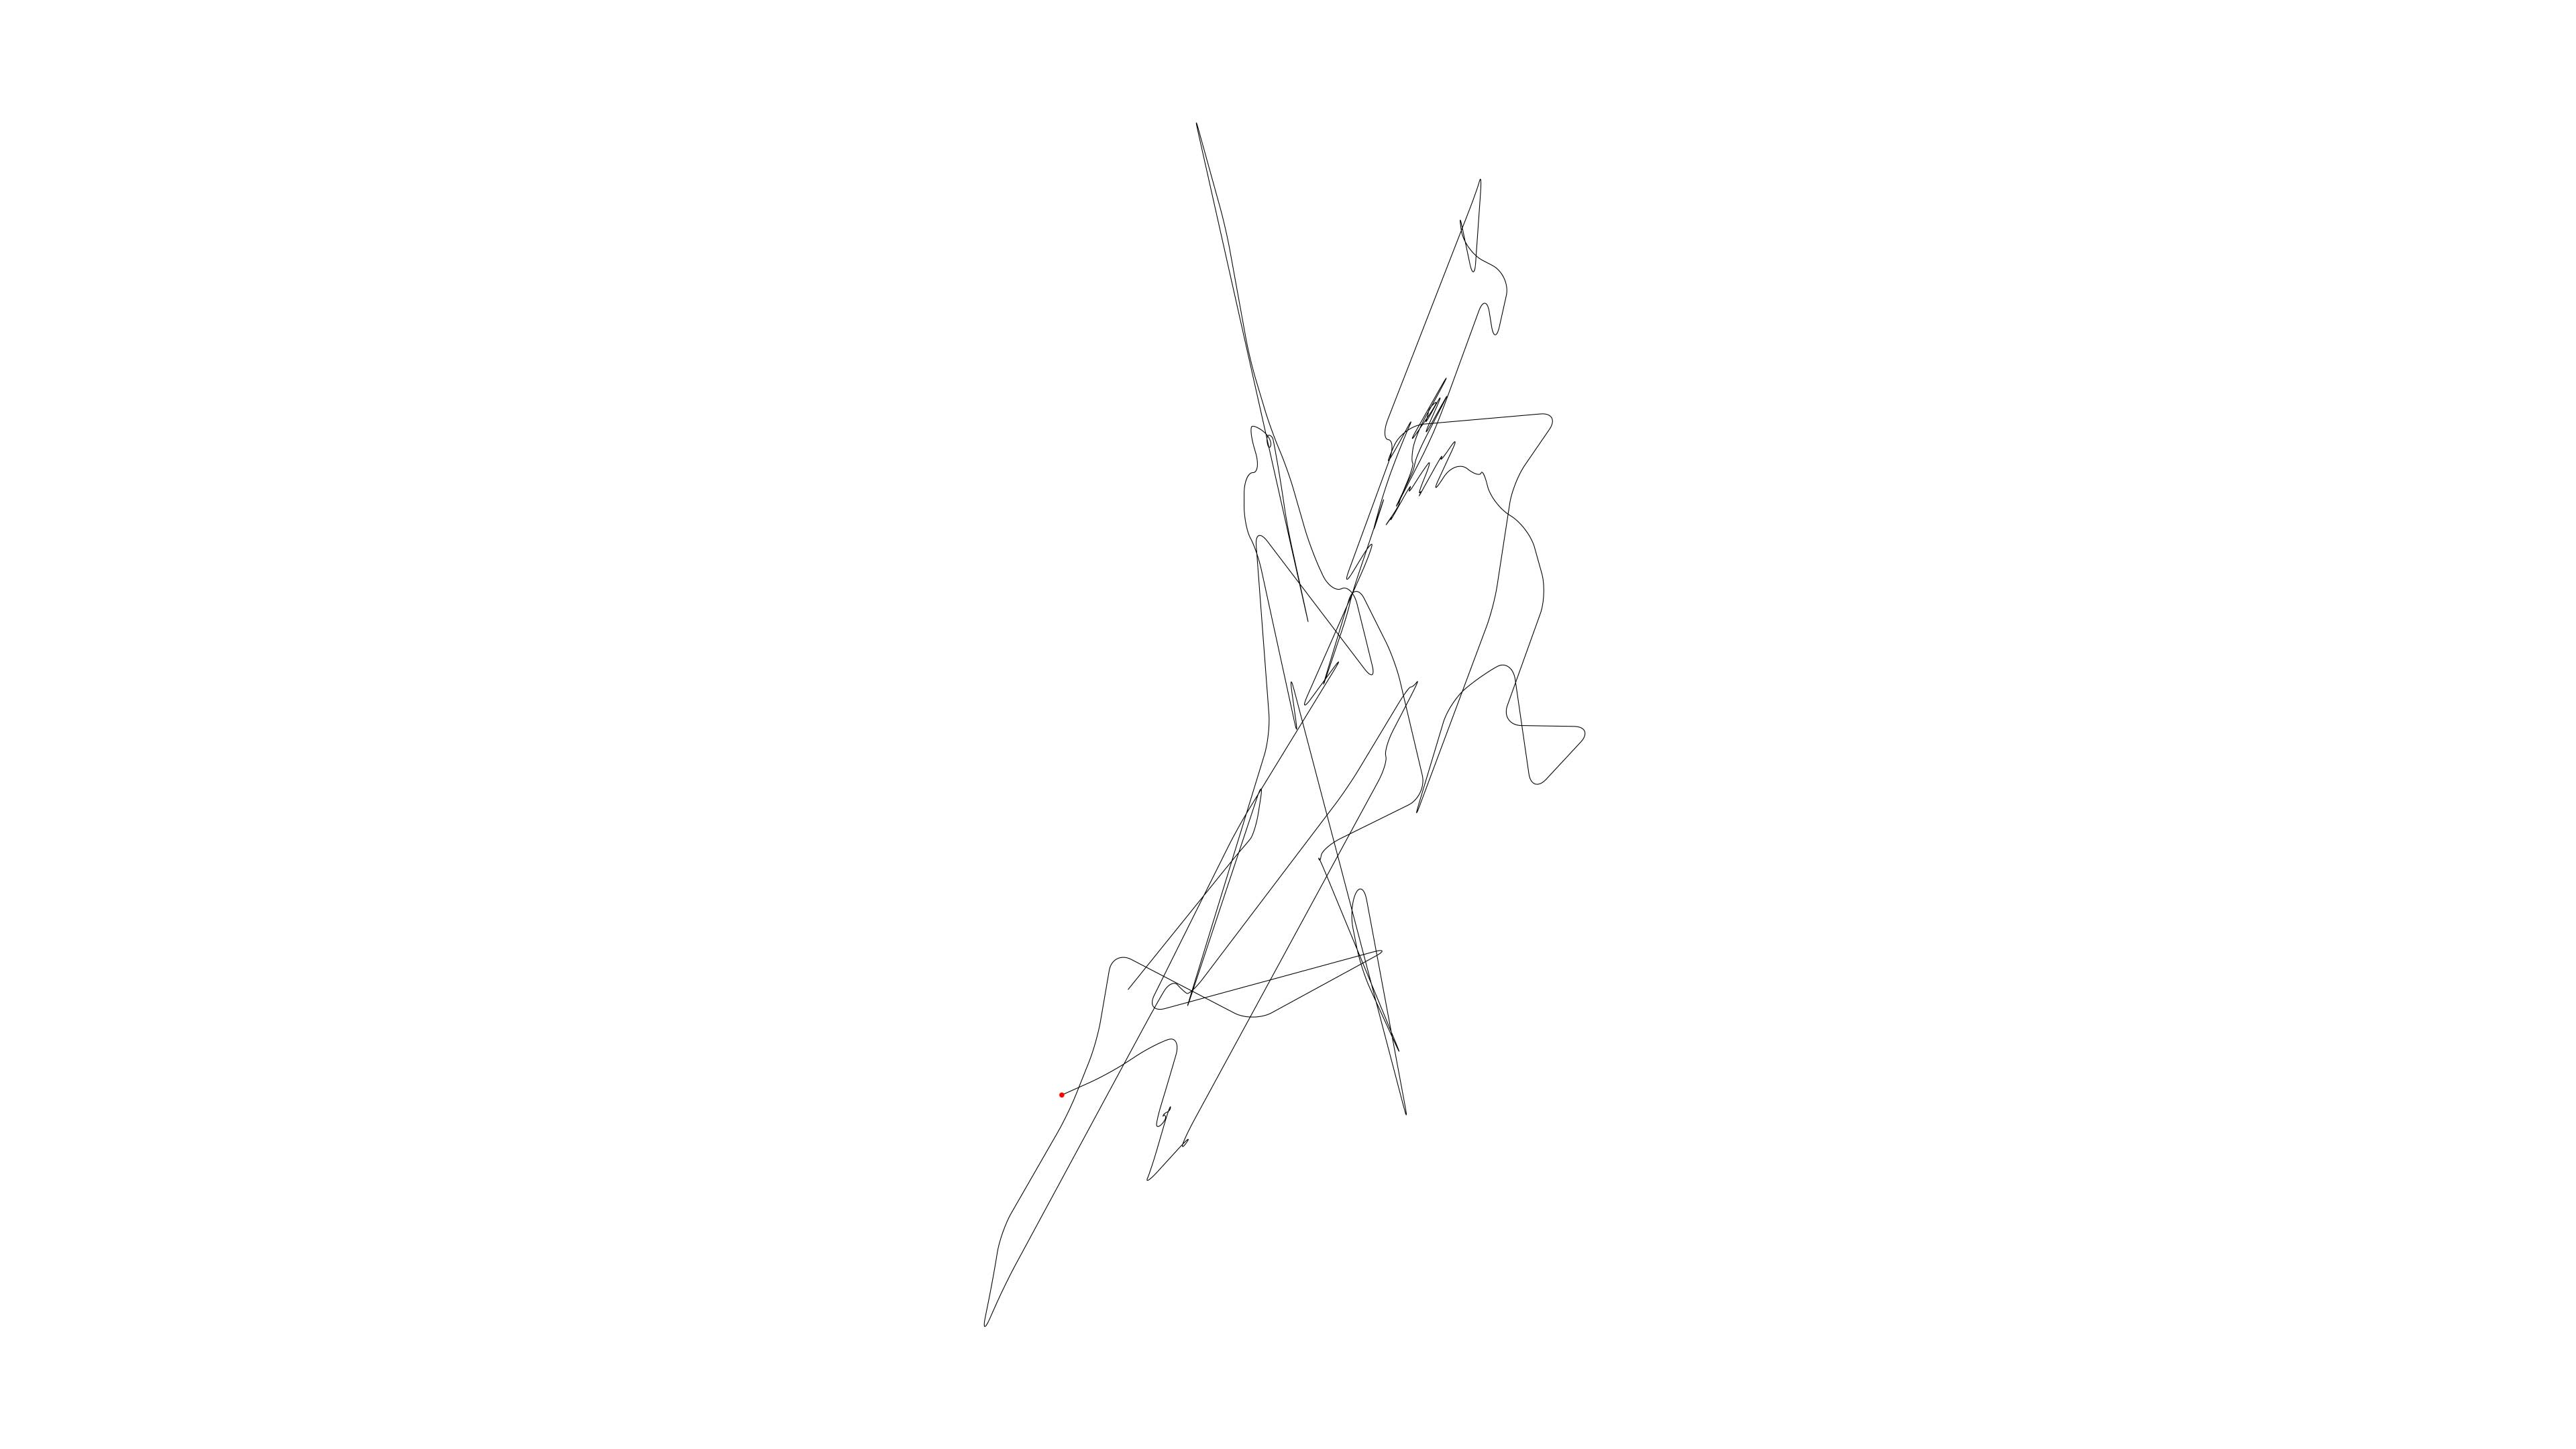
For an immovable GPS receiver, if the selected sampling method is time or frequency, the ideal Track Log is a series of overlapping waypoints with identical location and elevation, zero distance and speed, plus a number of timestamps; if the selected sampling method was distance, the ideal Track Log is a single waypoint (location and elevation), with zero distance and speed, plus a single timestamp. However, our setup had recorded a Track Log of 8438 positions on a 34.7km long path covering an area of 2.1km2, with an average speed of 0.2km/h and a maximum speed of 17.9km/h (Figures 1 and 2). This is a consequence of the limited precision of a GPS receiver operating inside a building under slightly changing weather conditions, combined with the inaccuracy of GPS infrastructure (Thin et al. 2016).
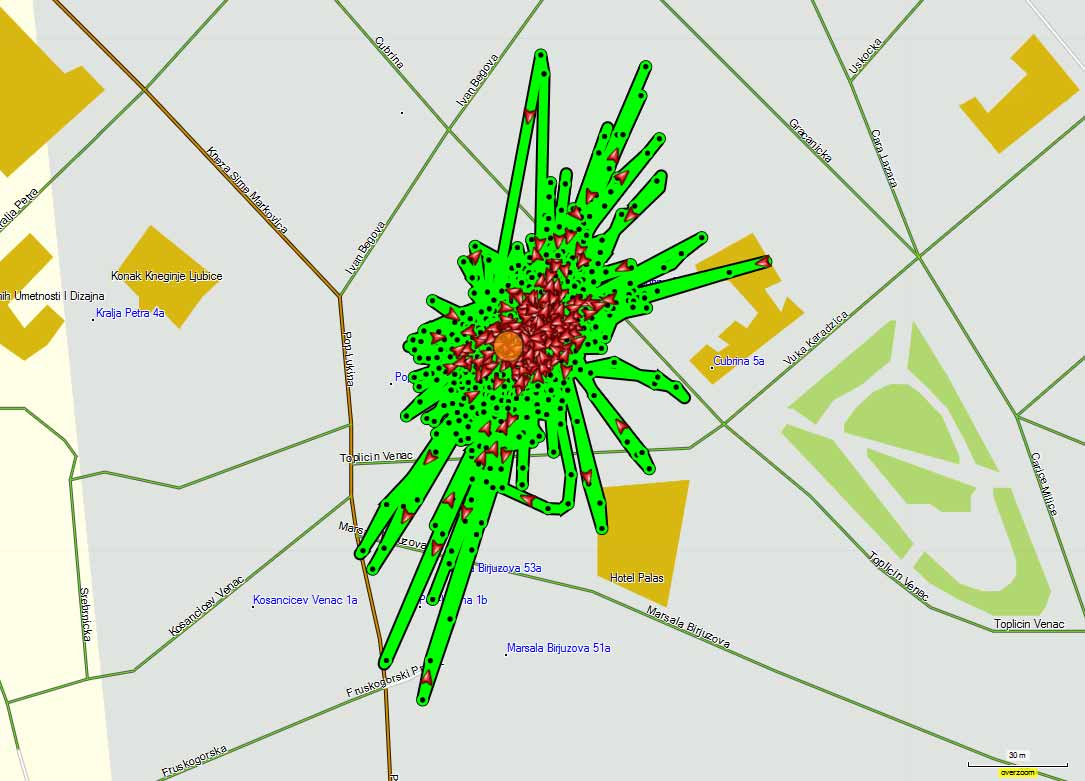
Figure 1. Horizontal projection.
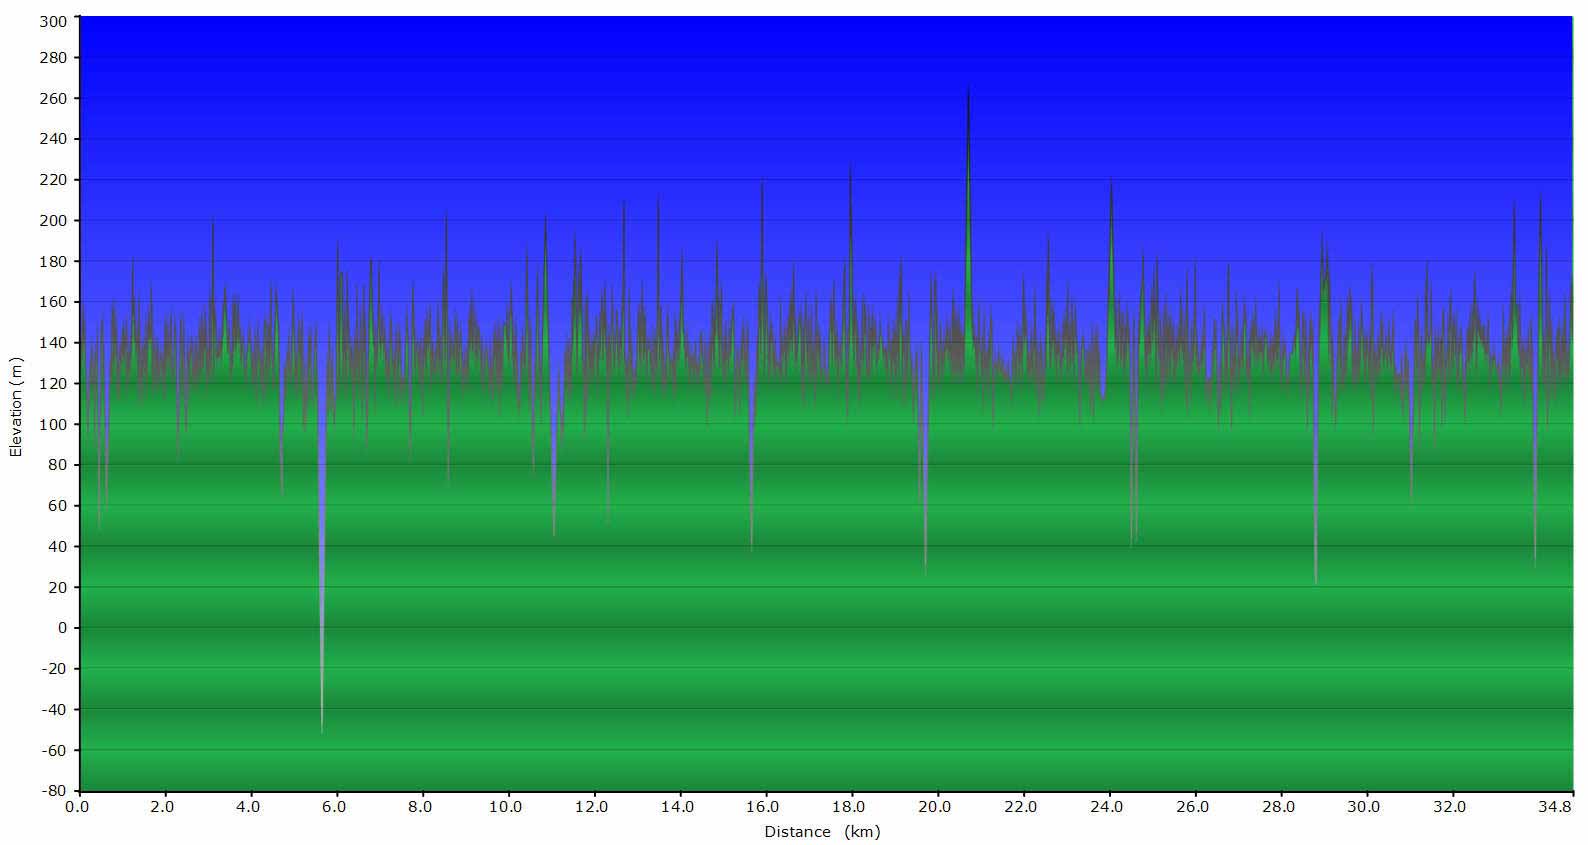
Figure 2. Elevation data.
We have originally produced this dataset in the Study project (2010) for the Rhizome of the City exhibition in the Museum of Science and Technology in Belgrade, which explored the artists’ cognitive mapping through the GPS and the Internet. We combined the Track Log path (longitude, latitude and altitude) (Figure 3) with the geopaths of the IP routes for the websites we had been browsing while the GPS receiver was running the Track Log (Grba 2010b).
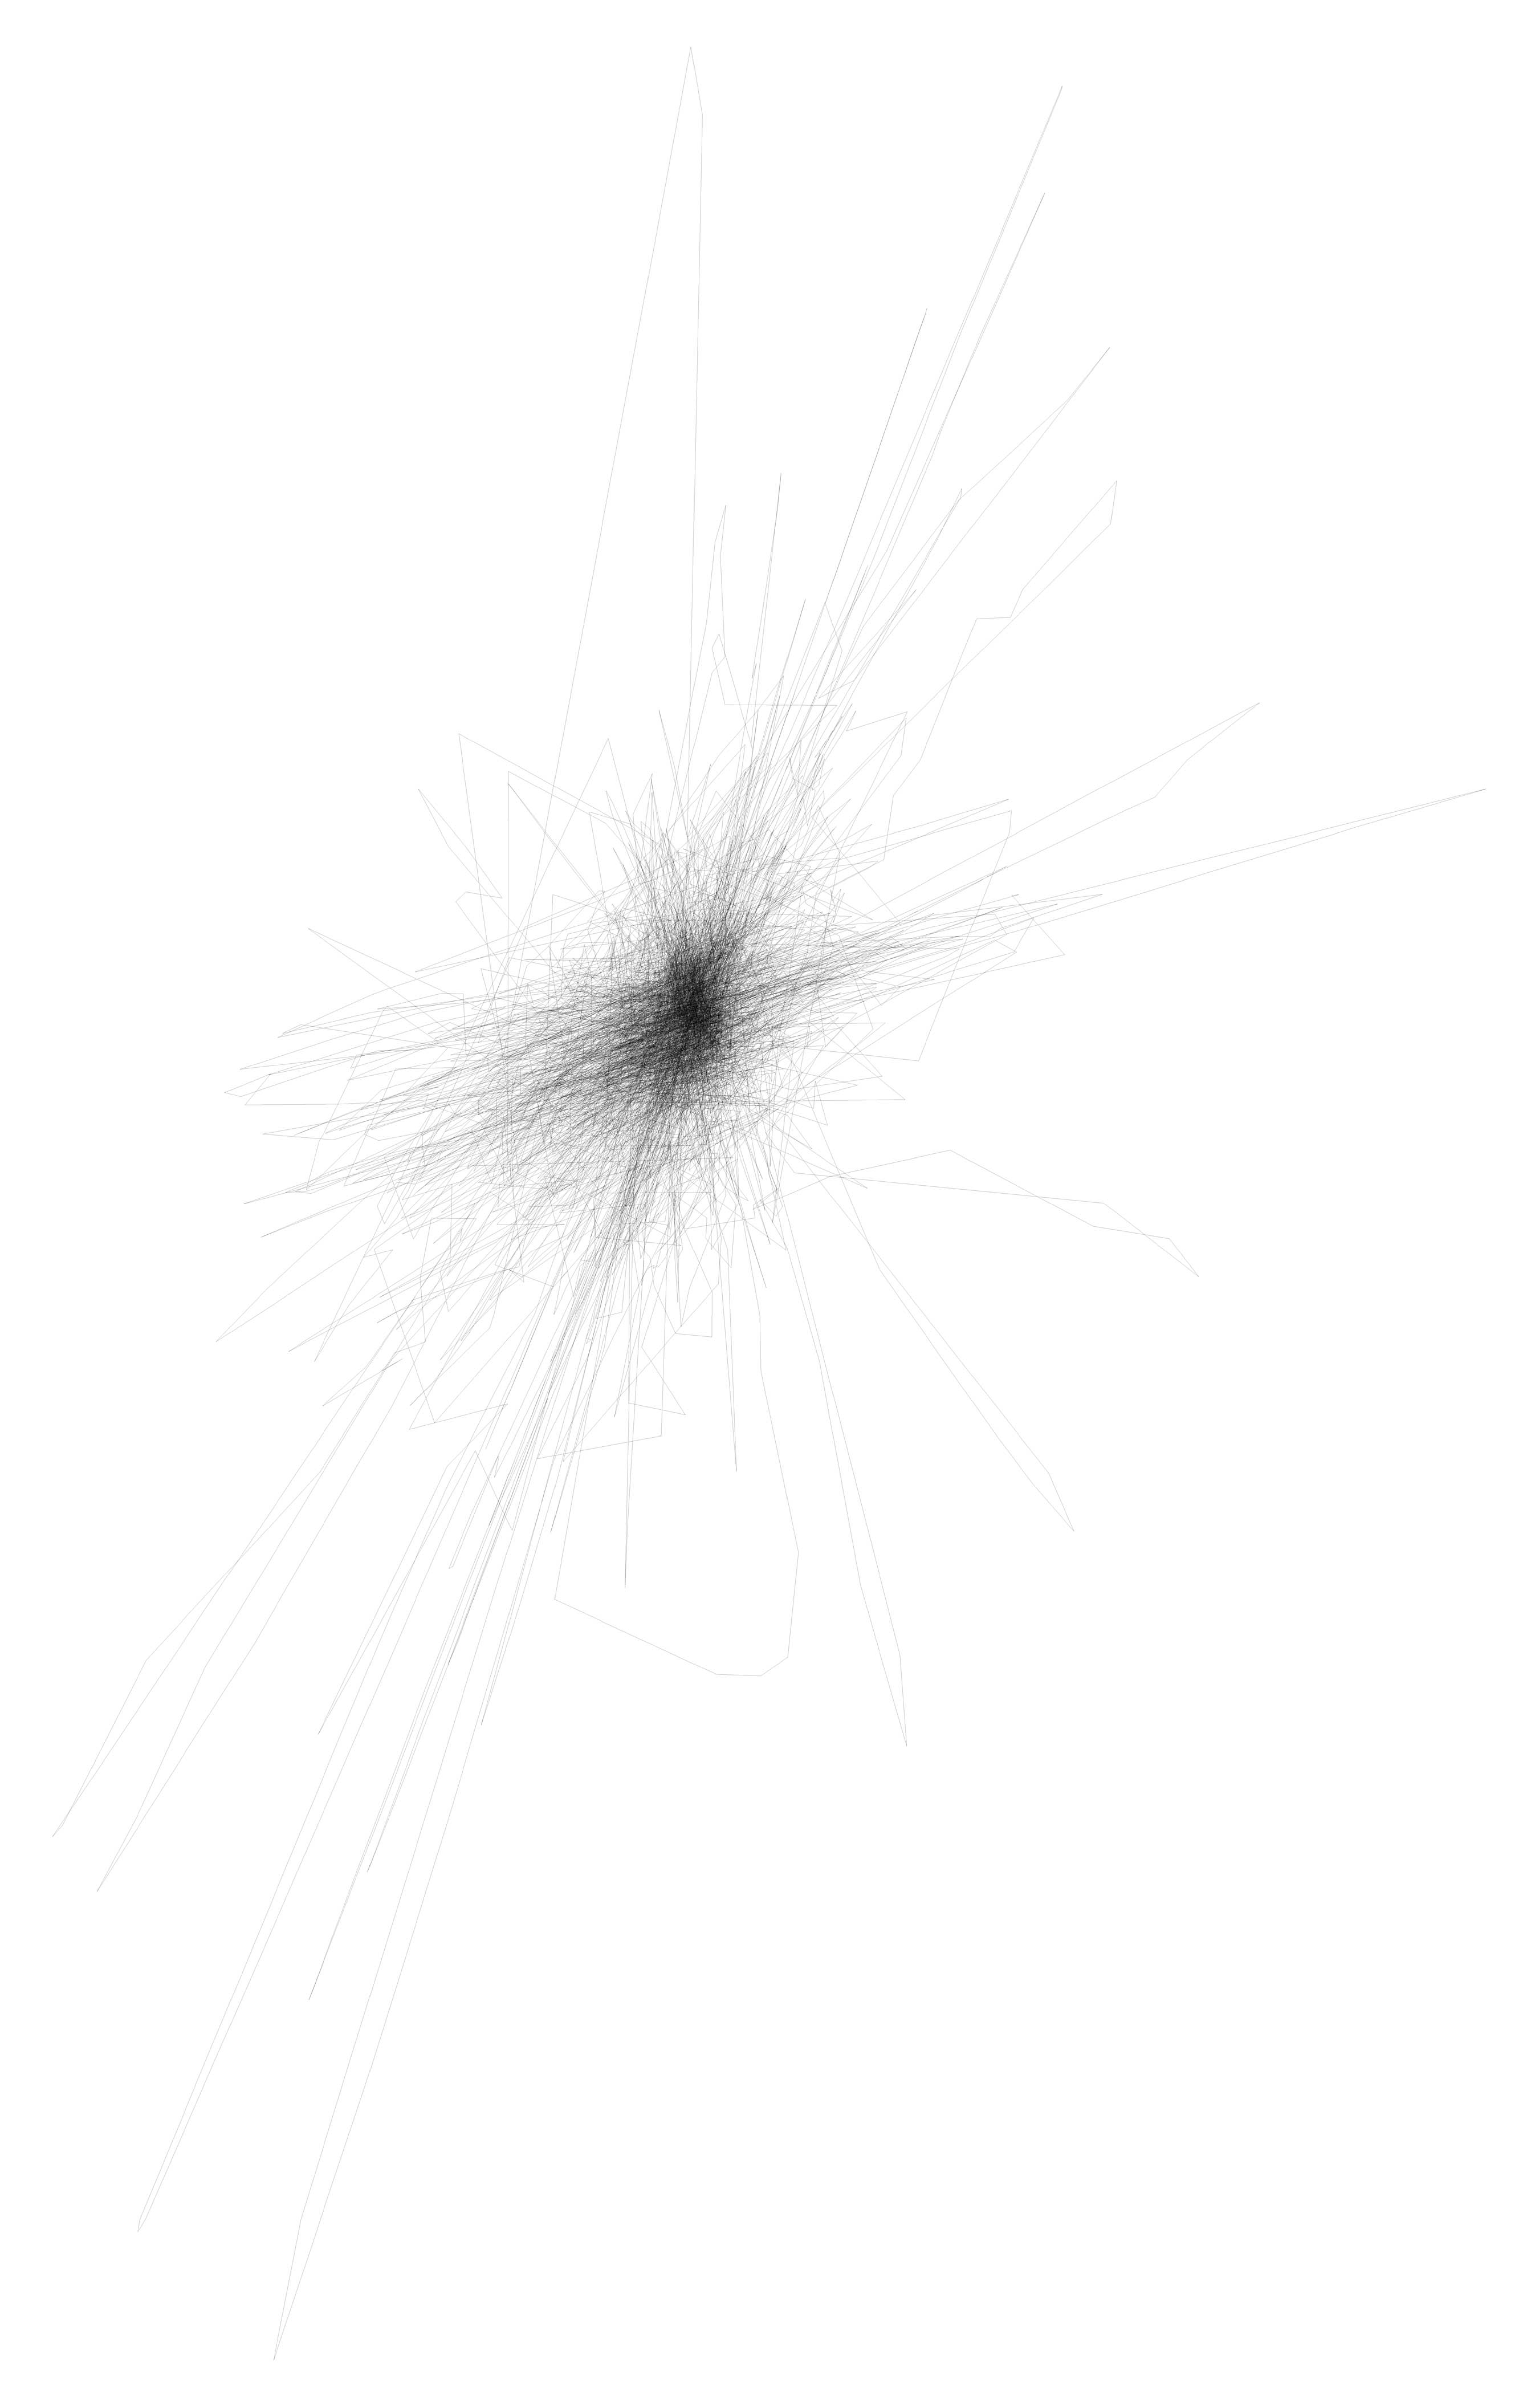
Figure 3. Horizontal projection of the Track Log path.
2D Animation
The recorded Track Log is a complete spatiotemporal dataset in which the three-dimensional spatial points (longitude, latitude, and altitude) carry the timestamps. When interpreted in its original sense—3D points interpolated over time—it implies movement. To make the 2D animation, we used the timestamps of the longitude and latitude waypoint data to move a red dot along the horizontal projection of the Track Log path, speeding up the 630,971 seconds of the real-time record into 281.233 seconds (4 minutes and 41 seconds at 30fps).
We created two versions of the animation. In the first, we visualize the current 2.25% section of the complete path (780m), revealing the intricate dynamics of error-generated virtual motion. In the second version, we visualize the current 2.25% building up the whole path. To contextualize the visuals, we display all the dataset values: longitude, latitude, altitude, distance, hop (time between the two waypoints), speed, and heading at the bottom; and the recording date, time, duration, and path length at the top of the frame. The animations are resolution independent, and are usually presented precomposed in parallel as a single channel UHD video, or as a synchronized two-channel HD video.
Sonification
We consistently used the Track Log dataset as a generator for the sound material. An apparent way to turn such a dataset into sound would be the projection of the recorded GPS coordinates into a Euclidean space whose axes represent sound synthesis parameters such as, for instance, the frequency of an oscillator. However, we decided to follow the metaphor of movement in real space and to exploit the acoustic effects that result from it.
When a sound source or the listener moves about in space the distance between them changes. This change of relative distance produces Doppler effects and modifications of the volume because of distance-related damping. The Doppler effect refers to the change of the wave frequency due to a change of distance. If the distance between the source and the listener decreases, each sound wave takes less time to reach the listener. Hence, the sound waves are condensed, which results in an increase of frequency and the perception of a higher pitch. Conversely, if the distance increases, the sound waves are more spread out, the frequency is lowered, and a lower pitch is perceived. The distance-related damping of sound levels has two causes: the overall sound volume drops with the increase of the distance between the sound source and the listener, and there is an additional attenuation of high frequencies due to the energy loss of sound as it propagates through air.
We aimed to create a strong, yet only metaphorical analogy to these acoustic phenomena associated with the moving sound sources. We used delay lines whose variable delay times lead to shifts of the perceived pitch (the Doppler effect). We used low pass filters whose variable cutoff frequency recreates the effect of air absorption. However, we did not intend to establish authenticity by building a proper physical model. All these devices were applied freely as individual sound design components and scaled according to aesthetic considerations.
The Track Log dataset was searched for the maximum deviation of the recorded waypoint from the actual geospatial location of the GPS receiver. This maximum distance defined a square with the actual geospatial location of the GPS receiver as its center. Four virtual sound sources (S1–S4) were placed in each corner of this square, and the waypoint position data was used to control the movement of a virtual microphone (M). The resulting distances (D1–D4) form the parameters for the sound processing (Figure 4). In relation to the dimensions of the square, the coordinates of the microphone were normalized to the range [-1,1] and the distances between the microphone and the four virtual sound sources thus calculated. Subsequently, each signal was attenuated, filtered and delayed based on the respective distance (Figure 5).
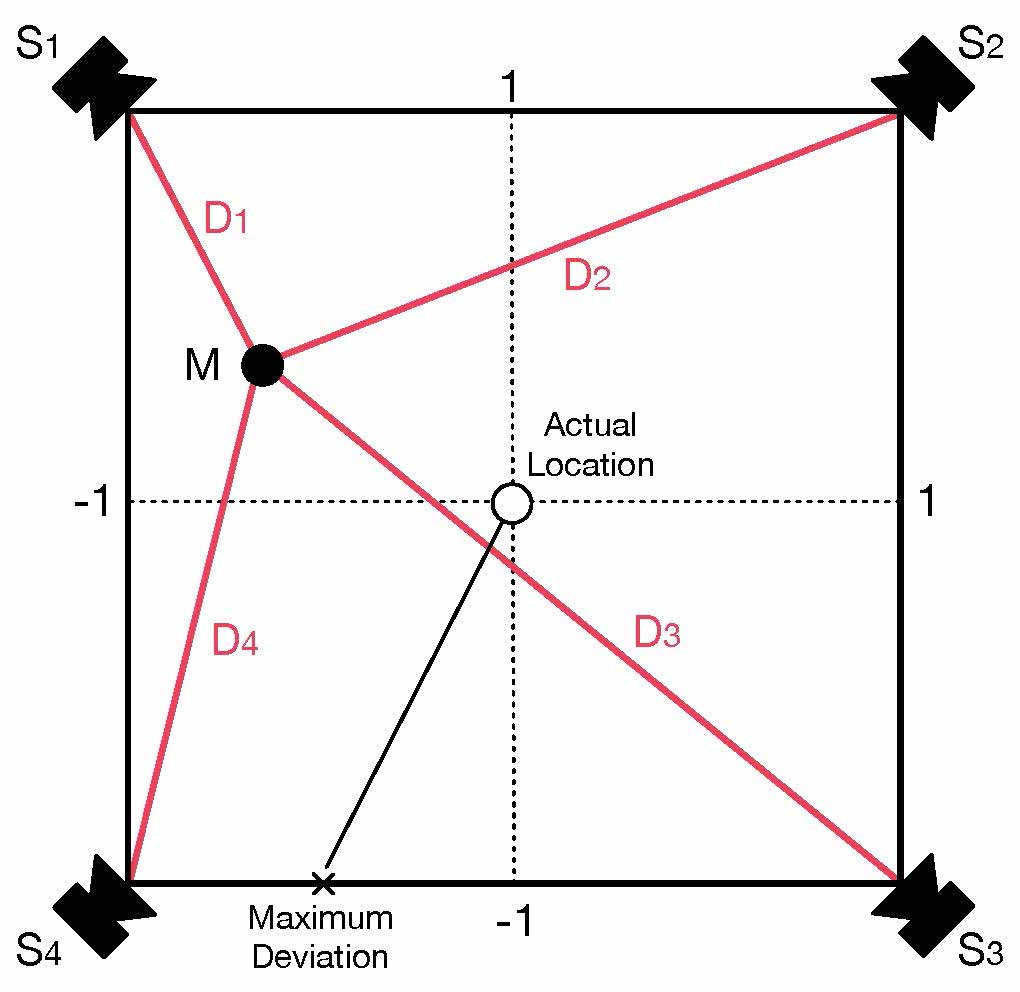
Figure 4. Sound sources.
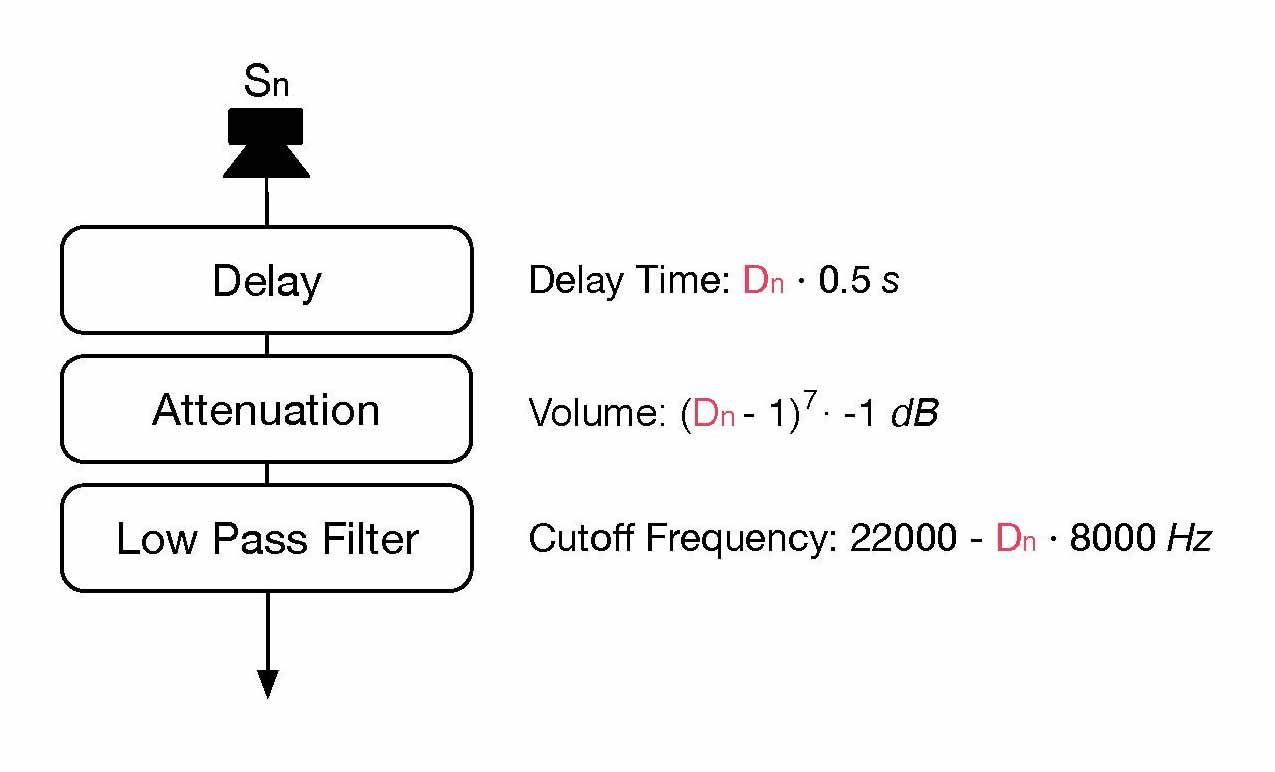
Figure 5. Signal flow.
The sound material consists of band-limited pulse trains with the frequencies 3, 5, 7 and 11Hz. This superimposition of prime number frequencies yields a compact rhythmical texture. In the course of the piece, the four pulse trains become slightly faster, which creates a slow but steady increase in density. This compensates for the listeners' gradual habituation to the quality of the sound and is in line with the visual accumulation and increasing jaggedness of the animated path. The signals were further processed in order to enhance the sound. First, a high pass filter was applied to render the sound less booming. Second, the sound signals were distributed among the two channels, as if the virtual microphone was a stereo microphone. And third, a subtle reverberation was added.
Further Work
The interrelated generative parameters recorded in the Track Log dataset allow different types of visualization, animation, sonification and presentation. We are developing an interactive animation using the three-dimensional spatial data (longitude, latitude and altitude) and the timestamps. This major iteration features an exploratory VR interface which initially puts the viewer in the subjective position of the erroneous GPS waypoint, and enables them to navigate the experience by changing the viewing angle, position and lighting parameters.
References
Barker, Tim. 2012. “Aesthetics of the Error: Media Art, the Machine, the Unforeseen, and the Errant.” in Nunes, Mark, ed. Error: Glitch, Noise and Jam in New Media Cultures. New York and London: Bloomsbury Academic: 42-58.
Boyé, Paul, Dejan Grba, Kristy H. A. Kang, Melentie Pandilovski and Vladimir Todorović. 2019. “Machine Flaws in Generative Art.” In Juyong Park, Juhan Nam and Jin Wan Park, eds. Lux Aeterna, ISEA2019 25th International Symposium on Electronic Art proceedings. Gwangju, Korea: 713-716.
Grba, Dejan. 2010a. “I Know What I Drew Last Summer.” Rhizome of the City exhibition catalogue. Belgrade: Museum of Science and Technology.
Grba, Dejan. 2010b. “Study.” Dejan Grba’s website. https://dejangrba.org/art-projects/en/2010-study/index.php.
Grba, Dejan. 2015. “Get Lucky: Cognitive Aspects of Generative Art.” In Celestino Sodu, ed. XIX Generative Art Conference Proceedings. Venice: Fondazione Bevilacqua La Masa: 200-213. https://dejangrba.org/lectures/en/2015-get-lucky.php.
Thin, Li Nyen, Lau Ying Ting, Nor Adila Husna and Mohd Heikal Husin. 2016. “GPS Systems Literature: Inaccuracy Factors and Effective Solutions.” International Journal of Computer Networks & Communications (IJCNC). 8, (2), March: 123-131.
Wilson, Stephen. 2002. “Artistic Experimentation with GPS.” In Stephen Wilson. Information Arts: Intersections of Art, Science and Technology. Cambridge, MA: The MIT Press: 283-293.
Biographies
Dejan Grba is an artist, researcher and scholar who explores the cognitive, technical, poetic, and relational aspects of generative systems. He has exhibited in the Americas, Europe, Asia, and Australia, and published papers in journals, conference proceedings, and books worldwide. He has served as a Co-founding Associate Professor with Digital Art Program at Interdisciplinary Graduate Center, University of the Arts in Belgrade since 2005, and as a Founding Chair and Associate Professor at New Media Department, Faculty of Fine Arts in Belgrade from 1998 to 2020. In 2019/2020, Dejan was a Visiting Associate Professor at the ADM/NTU in Singapore.
Philippe Kocher is a musician, composer and researcher. He studied piano, electroacoustic music, music theory, composition and musicology in Zurich, Basel, London and Bern. His artistic and scientific work encompasses instrumental and electroacoustic music, sound installation, algorithmic composition and computer-generated music. Philippe works as a professor of music theory, composition, and computer music at the Zurich University of the Arts, and as a research associate and software developer at the Institute for Computer Music and Sound Technology (ICST) in Zurich.